Tales of Things
Where everything has its memory
The London Data Table

Created for the 2012 Smart Cities Exhibition organised by The Bartlett Centre for Advanced Spatial Analysis
Tales
CASA Smart Cities Conference
On Friday 20th April 2012 over 350 members of the public attended our Smart Cities ‘Bridging Physical and Digital’ open day and conference at Senate House, London.
The full day of talks, accompanied by the Smart Cities exhibition, was aimed at opening a discussion on the meaning behind the Smart City and, perhaps more importantly, how to make it a reality.
Four articles covering the day’s highlights and research announcements appeared in Wired with a further two in New Scientist, helping to make the event one of the most successful in the history of CASA.
Professor Michael Batty kicked off the day with the dynamics of urban places and how key technological developments can be used to gain an insight into the wider science of cities. Carlo Ratti, Director of MIT’s Senseable City Lab continued the theme with a keynote address, mixing computer science with architecture, art and design to envisage the digital city across a multitude of platforms.
Jon Reades was the first researcher whose work was picked up by Wired with a view on how data could be the solution to London’s stretched transport networks. As Duncan Geere of Wired notes: “Reades is working on taking data from Transport for London and using it to draw out information that can be used to better-inform decisions about what parts of the network need to be tweaked for maximum impact. Some of the early results are already intriguing. A large proportion of commuting journeys aren't symmetrical -- they don't go to and from the same places. While in the mornings, people tend to travel straight to work in the quickest way possible, in the evenings they tend to stop off at a pub, or to see a friend and take a more circuitous route, reducing demand.”
With the first three talks complete the exhibition opened, showcasing a wide range of digital research from CASA presented in a physical from. As New Scientist asked: "have you ever looked at a pigeon and wished you could experience life through its beady eyes? Well now you can, thanks to the Pigeon Simulator – created as a new way to visualise the cities and its data feeds."
Data can be visualized in a myriad of ways, yet sometimes it is the simplest that are the most effective. The London Data Table cycled through a series of visualisations from live aircraft feeds through to data from the Barclays Cycle Hire Scheme to present a view of London from above.
Combining a projector with a short throw lens, a table cut to the outline of London and various processing scripts and movies allowed an instant view of complex data feeds.
-

Ativa AT-714 Calculator
-
The London Data Table
-

Andys Desk
-

The Tweet-o-Meter
-

Boris Karotz
-

Ugly Doll
-
Digital Urban Mug
-

1970's Rotary Phone
-

Smiths Pocket Watch
-

Andys Chumby
-

Book in the Wild
-
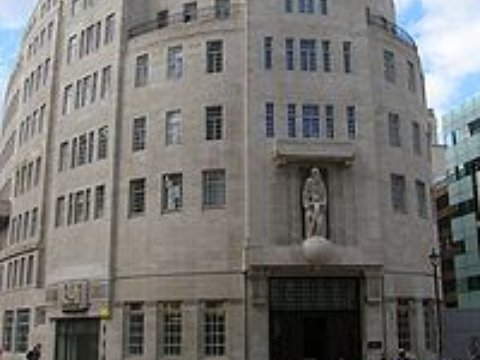
Broadcasting House
-
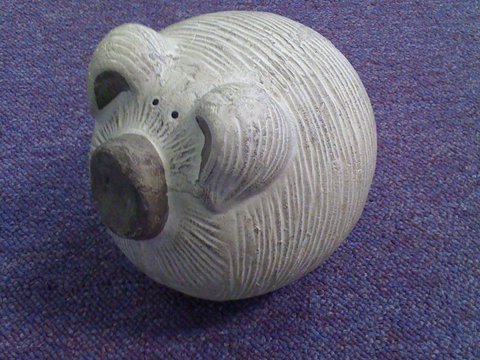
Sheep Pig
-
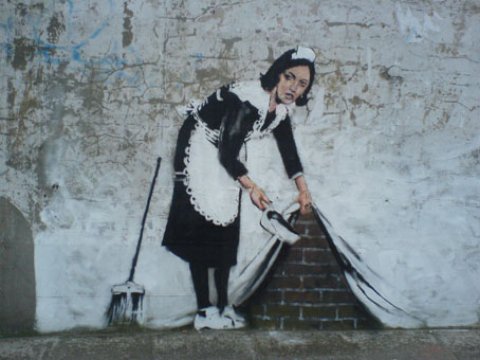
Banksy Camden Town
-
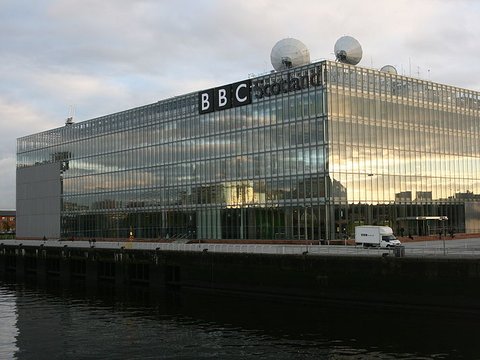
BBC Scotland - Pacific Quay, Glasgow
-
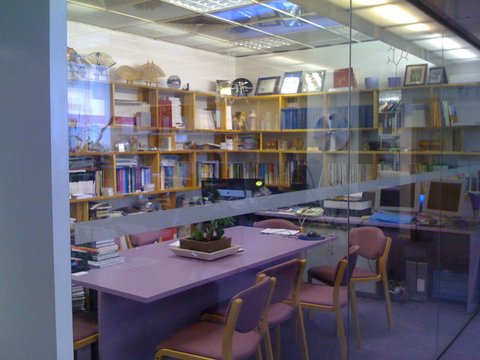
The CASA Office
-
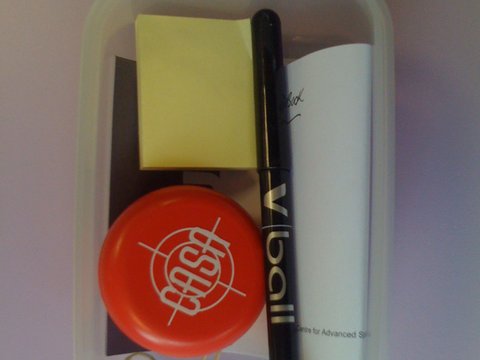
CASA Geocache
-
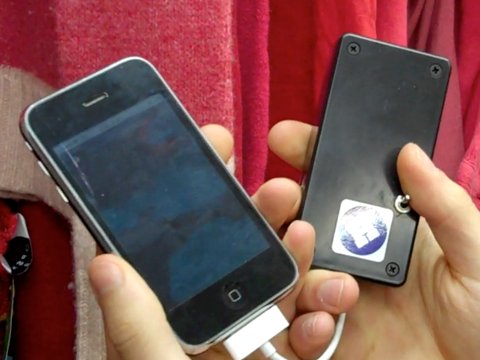
iPhone/Android RFID Reader
-

The Wonder Stuff
-

Planning
-
Pratt Street Camden Town
-
The CASA Fish Tank
-
Bingo!
-

Dwell
-
The Water Cooler
-
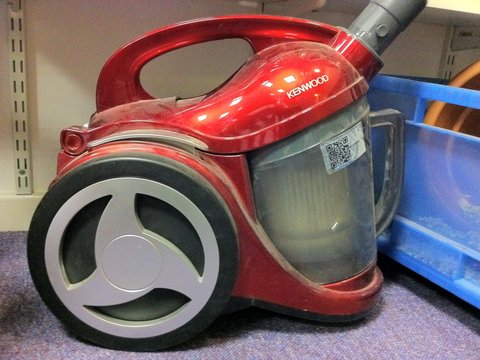
Rubbish Hoover
-

Wine and EBay
-
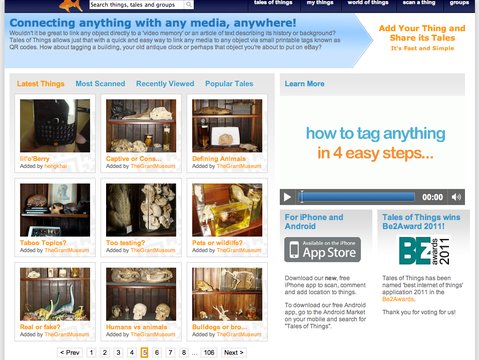
Tales of Things
-

Tales of Things Sensor
-

BBC Name Badge
-
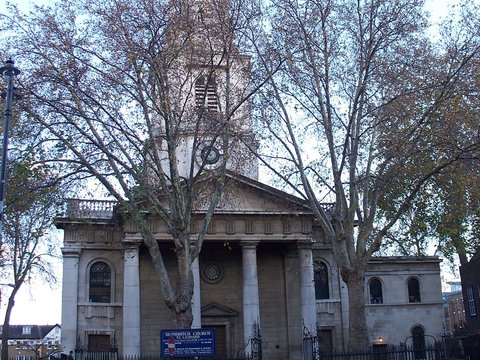
Shoreditch Church
-
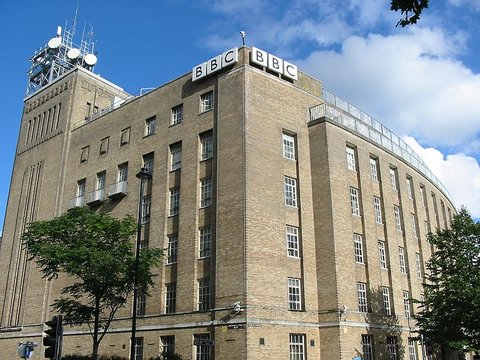
BBC Broadcasting House, Belfast
-

JJ72 CD
-

AGI GeoCommunity '10 Conference Tag
Comments